There is a great deal of geographic data available in formats that can not be immediately integrated with other GIS data. In order to use these types of data in GIS it is necessary to align it with existing Geographically reference data this process is also called Georeferencing. The process of Georeferencing relies on the coordination of points on the scanned image [data to be georeferenced] with points on a geographically referenced data [data to which the image will be georeferenced]. by "linking" point on the image with those same locations in the geographically referenced data you will create a polynomial transformation that converts the location of the entire image to the correct geographic location. call the linked points on each data layer control points.
The selection of control points is important:
They should be easy to confirm as representing the same geographic location (landmark, political boundary, etc...).
They should be spread across the image to be registered one suggestion is to select a control point near each of the corners of the image and few throughout the interior will often work well.
Good overlap between the two often dataset is also important.
Make sure you are clicking as close possible to the same geographic location, zooming in can help in this process.
What is Georeference?
Georeferencing is the internal coordinate system of a map (or) aerial image can be related to a geographic coordinate system. The relevant coordinate transforms are typically stored within the image file there are many possible mechanisms for implementing georeferencing,...
How to Georeference in ArcGIS
Georeference is the process of transforming a scanned map (or) aerial photograph so it appears in place in gis. by linking, connecting (associating) features on the scanned image with real world x, y coordinates. The software can progressively warp the image so it fits to other spatial datasets. This tutorial will explain how to georeference a raster image in arcgis so it can then be used as an overlay or for digitizing purposes. in this example _ a historic Toronto map will be georeferenced using a dataset.
Process,-
(Georeferencing a Raster to a Vector)
Open ArcGIS(ArcMap):-
STEP-1 in ArcMapadd the layer residing in Mapcoordinates and add the raster dataset you want to Georeference.
Adding the data with the map coordinating system first is a good practice so you do not need to set the data frame coordinating system.Note-(study area Change the coordinating system to suit you will be selected)
STEP-2 To display the Georeferencing toolbar click the customize menu and click toolbars > Georeferncing.
STEP-3 in the table of contents, right-click a target layer and clickzoom to layer.
it may be helpful to set your Extent used by Full extent Command, within the Data Frame properties, to your study area so the Zoom to Full Extent tool will automatically zoom to the full extent of your study area.
STEP-4 From the Georeferencing toolbar, click the layer drop-down arrow and choose the raster layer you want to Georeference.
STEP-5 Click the Georeferencing drop-down menu and clickFit to Display. This displays the raster dataset in the same area as the target layers. You can also use the Shift and Rotate tools to move the raster dataset as needed. To see all the dataset, adjust their order in the table of contents.
SETP-6 Click the Add Control points tool to add control points.
SETP-7 To add a link click a know location on the raster dataset, and click a known location on the vector layers in map the reference data.
You can also your link in the magnification window (or) the viewer window. if you are using polygons as your referenced layer, you can open the effects toolbar to adjust the transparency as you add your links.
SETP-8 Add enough link for the type of transformation you will apply.
You need a minimum of 1 link for zero-order polynomial, 6 link for a second-order polynomial, and 10 link for a third-order polynomial (or) spline transformation.
SETP-9 Click the view link table button to evaluate the transformation.
You can examine the residual error for each link and the root mean square RMS error. If you are satisfied with the registration, you can stop entering link.
SETP-10 Delete any unwanted link from the link table.
SETP-11 Click the Georeferencing drop-down menu and click either Update Georeferencing or Rectify. Updating the georeferencing will save the transformation information with the raster and its auxiliary files. Rectifying will create a new file with the georeferencing information.
You don’t need the control points
anymore.
Keep the magnifier window open since you
may want to use it when digitizing the layer.
Note - Georeference Complete and Save as Referencing Map End...
A Geography information system (GIS) is a framework for gathering, managing and analyzing data. Rooted in the science of geography, GIS integrates many types of data. It analyzes spatial location and organizes layers of information into visualizations using maps and 3D scenes. With this unique capability, GIS reveals deeper insights into data, such as patterns, relationships and situationsusers make smarter decisions.
What is GIS
Hundreds of thousande of organization in virtually every filed are using GIS to make maps the at communicate, perform analysis, share information, and solve complex problems around the world. This is changing the way the world works.
How GIS woks
GIS technology applies geographic science with tools for understanding and collaboration. it helps people reach a common goal: to gain actionable intelligence from all types of data.
Maps
Maps are the geographic container for the data layers and analytics you want to work with GIS maps are easily shared and embedded in apps and accessible by virtually everyone, everywhere.
Data
GIS integrates many different kind of data layer using spatial location. Most data has a geographic component. GIS data includes imagery, feature and base maps linked to spreadsheets and tables.
Analysis
Spatial analysis lets you evaluate suitability and capability, estimate and predict, interpret and understand and much more, lending new perspective to your insight and decision - making.
Apps
Apps provide focused user experience for getting work done and bringing GIS to life for everyone. GIS apps work virtually everywhere: on your mobile phones, tablets, in web browsers and on desktops.
Geo is Nothing But, geo is Earth...
What
is map:
A
Example:
The creating a map to get to your house. A map is a visual representation of an (GEO) entire area (or) a part of an area.
cartographer:
A cartographer is a person who makes maps and charts, Art (or) technique of making maps (or) charts is called cartography.
Types of maps:
1). Physical (or) Relief maps
2). Political maps
3). Thematic maps
1). Physical (or) Relief maps:
The map that we see here is a physical map show the physical features of an area.
such as the mountains, rivers and lakes, platen. by using colors.
The water is shown in blue, green is used for showing plain areas.
brown is used for showing mountains (or) hills.
2). Political maps:
The map shown here is a political map.
political maps shown the states, national boundaries, capital and major cities of a country.
3). Thematic maps:
The map shown here is a thematic map.
Thematic map give details about different aspects of different places such as weather, transport, tourist attractions. they cover a certain theme (or) topic.
what is a map Legend?
A map Legend is included with a map to unlock it. it gives you the information needed for the to make sense. map often use symbols (or) colors to represent things and the map legend explains what they mean. symbols in the legend might be pictures (or) icons that represent different things on the map.
What is
Geo mapping?
A
process of determining locations and adjacency of different types of goods
displayed in a store.
A
graphical representation of a process, structure or system that depicts arrangement of and relationships among its different
components.
Traces Flows Of Energy
Goods
Information
Materials
Money
Personnel
See also mind Geo mapping.
Type Of Images File Format:
JPEG File
TIFF File
GIF File
PNG File
EPS File
What is JPEG file?
A computer format for recording still (Joint Photographic Experts Group) Color image, particulars photographs with millions of colors, a computer files saved in this format.
What is TIF file?
Multiple image transport to keep file
together (Taggedimage file format)
Useful for transporting multiple images, Capable of storing multiple images.
Disadvantages_ Often creates large file size.
What is GIF file?
A single GIF image palette is limited to
256 colors, this means it is not often
used for digital photographs.(Graphics interchange format) GIF file are used in business for things
such as web design animated sprites (for
games) power points. Almost every computer supports them.
What is PNG?
Supports up to 48-bpi will not degrade
quality over time true replication decreased file size supports up to 48-bpi varied transparently.
Disadvantages_ Normally unable to reach JPEG file
reduction (10mb-11mb)
What is EPS file?
It also usually contains a bit map
version of the image for simplerviewing rather than the vector instructions
to draw the image.
EPS is a file extension for a graphics
file format used in vector-based images in adobe illustrator.
What is Shape file?
The shape file format is a Geo spatial vector
data format for geographic information system (GIS) software the shape files
format can spatiany describe vector features.
(point, Line and Polygons representing for example water wells, rivers, and lakes).
Geography Information System(GIS)
Geography information system are computer based systems that can deal with virtually any type of information about features that can be
referenced by geographical location. These systems
are capable of handling both locational data and attribute data about such features. That
is, not only do GIS permit the automated mapping (or) display of the location
of Features,
but also these systems provide a capability for recording and analyzing
descriptive Characteristics
about the features. For
example, a GIS might contain not only a ‘map’ of the locations
of road but also a database of descriptors about each road. These
‘attributes’ might include
information such as road width, pavement type, speed limit, number of traffic
lanes, data
of construction, not so on. Table 1.1 lists other examples of attributes that might be associated
with a given point, line, or area feature.
Much
of the power of a GIS comes from the database management system (DBMS) that is designed
to store and manipulate these attribute data. Many GISs employ a relational database,
consisting of tables, or ‘relations’, with attributes in columns and data
records, or ‘tuples’
in rows (Example-1.1).
(Example-1.1)
Example-1.1 point, line, and area features and typical attributes contained in a GIS.
Point
feature well (depth, chemical constituency). Line
feature power line (service capacity, age, insulator type). Area feature soil mapping unit (soil type, texture color, permeability).
Recently
there has been interest in object oriented databases, in which data objects take on more complex properties of their
own. while database implementations
vary, there are certain desirable characteristics that will improve the utility
of a database in a GIS. These
characteristics include flexibility, to allow a wide range of database queries
and operations; reliability, to avoid
accidental loss of data; security, to limit access to authorized users; and
ease of use, to insulate the end user from the details of the database
implementation. Often the user can interact with the DBMS to search for information
by means of “queries” simple commands (or) questions in a language that can be
understood by the DBMS. The most common query language is known as for SQL,
(or) structured query language, and several accepted standards for SQL have
been adopted.
One of the most important benefits of a gis is
the ability to spatially interrelate multiple types of information stemming
from a range of sources. This concept is illustrated in figure 1.25, where we
have assumed that a hydrologist wishes to use a gis to study soil erosion in a
watershed. As shown, the system contains data from a range of source maps (a)
that have been geocoded on a cell-by-cell basis to from a series of land data
files, (or) layers (b), all in geographic registration. The analyst can then
manipulate and overlay the information contained in, (or) derived from, the
various data files. In this example, we assume that assessing the potential for
soil erosion throughout the watershed involves the simultaneous cell-by-cell
consideration of three types of data.
Derived from the original data files: slope, soil erodibility, and surface runoff potential. The slope information can be computed from the elevations in the topography file. The erodibility, which is an attribute associated with each soil type, can be extracted from a relational database management system incorporated in the GIS. Similarly, the runoff potential is an attribute associated with each land cover type (land cover data can be obtained through interpretation of aerial photographs (or) satellite image). The analyst can use the system to interrelate these three sources of derived data (c) in each gird cell and use the result to locate, display, and/or record areas where combinations of site characteristics indicate high soil erosion potential (i.e., steep slopes and highly erodible soil-cover combinations).
The
above example illustrates the GIS analysis function commonly referred to as
overlay analysis. The number, from, and
complexity of other data analysis possible with a GIS are virtually limitless.
Such procedures can operate on the system’s spatial data, the attribute data,
(or) both. For example, aggregation is an operation that permits combining
detailed map categories to create new, less detailed category (e.g., combining
“jack pine” and “red pine” categories into a single “pine” category). Buffering
creates a zone of specified width around one (or) more features (e.g., the area
within 50 m of a stream). Network analysis permits such determinations as
finding the shortest path through a street network, determining the stream
flows in a drainage basin, (or) finding the optimum location for a fire station. Intervisibility operations use
elevation data to permit viewshed mapping of what terrain features can be
“seen” from a specified location. Similarly, many GISs permit the generation of
perspective view portraying terrain surface from a viewing position other than
vertical.
Several constraints need to be considered when
combining data from multiple sources in a GIS, as in the example illustrated in
figure 1.25 Obviously, all of the data layers must cover the same geographic
area, (or) at least partially overlap. An equally important consideration is
that the data layers must share the same geographic cording system. While a GIS
can convert data from one coordinate system to another, it is necessary for the
user to understand the characteristics of the various types of coordinate
systems that may be used.
What is GIS? (Definition)
A computer system that can be used to
storage view process analyst manage and
integrate geographic information.
Application:
A) Decision
making
B) Data management and integration
c) Disaster
control
What is GIS data?
Spatial Data:
where is it?
Spatial information shows the
relationship between location and shapes of geographic features.
Attribute Data:
what is it?
Attribute data visually consisted by
several columns which represented to
different geographic features.
Attribute Data: Information
Storage the geographic information by a table which connected to different features.
For example: attribute of India include its name population GDP and other
information to this country.
GIS Data:
Two types GIS data one vector data next
one raster data.
(Vector Data andRaster Data)
Vector Data:
Vector data consists of individual points, which (for 2D data) are stored as pairs of X.Y co-ordinates. The point may be joined in a particular order to create lines, (or) joined into closed rings to create polygons. (Point, Line, Polygon)
There are three main vector data ty/pes in GIS are:-
Vector Data:
Geometry types in vector data are point line
polygon.
Point:
vector points are simply X.Y coordinates.
Generally they are a latitude and longitude with a spatial reference frame. when features are too small to be represented as polygons. points and used.
Example:House, population etc...
Line: vector lines connect each vertex with with paths.
Basically, you're connecting the dots in a set order and it becomes a vector line with each dot representing a vertex.
Example:Road, River and Railway line etc..
Polygon:
when you join a set of vertices in a particular order and close it, this is now a vector polygon feature.
Raster data:
The Raster data is made up of pixel has an associated value. simplifying slightly a digital photograph is an example of a raster dataset where each pixel value corresponds to a particular color.
in GIS, the pixel values may represent elevation above sea level (or) chemical concentration (or) rainfall etc...
There are five main raster data types in GIS are:-
satellite Imagery:
satellite imagery are image of the earth or other planets collected by imaging satellites operated by government and businesses around the world. such data are recorded in raster format.
satellite images can be displayed in black and white (or) in color. satellite images can also simulate color photographs if they have pixel values form the red, green and blue spectral bands.
Binary scanned File:
A binary image is one that consists of pixels that can have one of exactly two colors, usually black and white. Binary image also called bi-level or two-level. This means that each pixel is stored as a single bit- i.e., ao or 1.
Graphic File:
In this type of raster data we can include maps,
photographs and images which can be stored as digital graphic files.
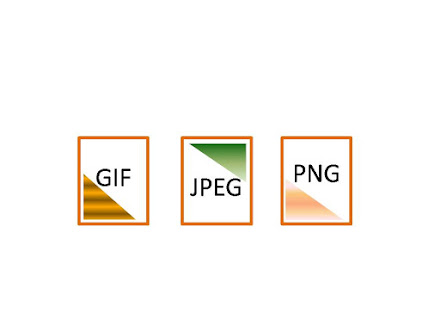
Major popular graphic files in raster format are: (GIF, PNG, JPEG)
GIF - Graphic Interchange Format.
PNG - Portable Network Graphics.
JPEG - Joint Photographic Experts Group.
Digital Elevation Models:
A digital elevation model (DEM) consist of an array of uniformly spaced elevation data. A digital elevation is point - based, but can easily be converted to raster data by placing each elevation point at the center of a call.
Digital Orthophotos:
A digital orthophotos quad (DOQ) is a digital image prepared from an aerial photographs or other remotely sensed data, in which the displacement caused by camera tilt and terrain relief has been removed.
This modal Raster data:
Vector Files Modal:
Geo file:
Super GIS internal data format.
Geo file comprises two file .geo, .dbf.
The attribute table is stored in dbase (dbf )file format.
Shape file:
Shape file is the most vector file
format in the most commercial or publish GIS software.
Shape file comprises SHP, DTB, SHX, the
attribute table is stored in base dbf. file format.
Coordinate system:-
Ex: WGS 1984 ITRF 2008.
Projected coordinatesystem.
Ex: UTM transverse Mercator.
Geographic coordinate system:
Represent any location on earth by longitude and
latitude.
Ex: TYPHOON,EATHQUAKE.
The green which England was established the
position of zero degree longitude
and the equator has a zero degree
latitude.
Latitude:
The o of latitude is called the equaled
and the equator divides the globe into Vert hem and southern Harris spheres.
Longitude:
A
line which was intended to pass though the green which (LondoUK) Was
choose as the international zero longitude.
Projected coordinate system:
A projected coordinate system is
expressed the location on three dimensional by a flat two dimensional surface
which causes distortion in the shape area distance or direction of the data.
Advantage:
Calculate,
After projecting meter can be the
universe calculate unit.
Record,
Most maps are recorded by two dimension
maps form.
Projection:
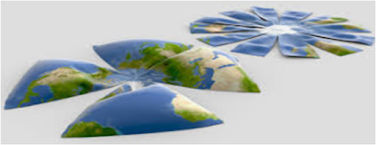
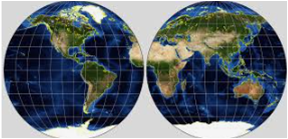
Earth-3D and 2D
Scale:
what is scale map:
Maps scale is the relationship between a unit of
lengthon the map and corresponding
length on the ground.
Example:-Square ='1cm' on the map ='200km' on the ground.
cartographer:
A cartographer is a person who makes
maps and charts
Art (or) technique of making maps (or)
charts is called cartography.